

Performance Engineering – JVM – Performance Monitoring (Open Source Tools)
-
JVM – Performance Monitoring
- Set up a application in your local machine/environment, for us to monitor it using tools
- Download and Extract Apache Tomcat (a java based application server)
- Setup Java, JRE, Path and Tomcat environment variables
- Start Tomcat by navigating to Tomcat /bin and run startup.bat
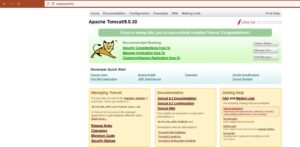
- Ensure Tomcat server is started successfully by accessing it via http://localhost:8080
-
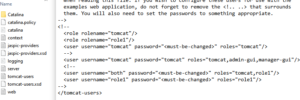
- {tomcat-directory}/conf tomcat-users.xml file configuration
-
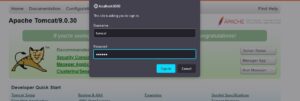
- Login to the application by clicking Manager App button, by giving tomcat and tomcat as the user credentials, which we already configured @ /conf
-
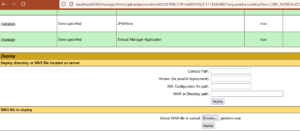
- Navigate to WAR file to deploy section and browse the .war file and click deploy
-
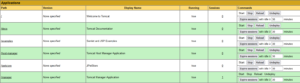
- Once the deployment is successful, the application will be listed here
-
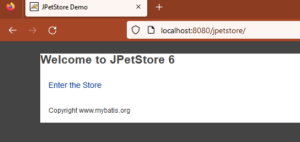
- Launch the application by clicking on /jpetstore URI, ensure the application is running as below
-
- Login to the application using the credentials – username (j2ee) and password(j2ee)

-
- Lets understand on the two applications those comes bundled with JDK to monitor the application’s metrics (which internally uses JVM)
- Java Visual VM (jvisualvm)
- JConsole
-
JVisual VM
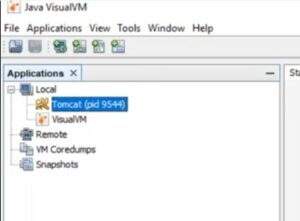
- Navigate to JDK/bin and open jvisualvm to view that the JPetStore application is already being listed to be monitored, as the application utilizes the backend java runtime(JVM)
- Analyze the behavior of Heap, GC, CPU, Memory metrics via Monitor tab
- We can perform the below kinds of analysis using the Java VisualVM
- Heap Analysis
- Thread Analysis
- Garbage Collection Analysis
- Access your already listed application (Tomcat being the one referred to here), Navigate to Monitor tab
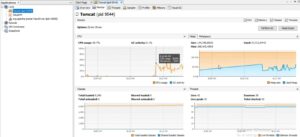
- Make sure the CPU Utilization never crosses 80%, as well the Garbage Collection activity
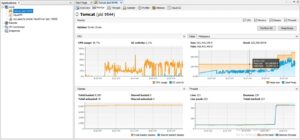
- Discuss with DEV and Product teams to understand the results by comparing the already discussed SLA’s, and take necessary steps to resolve these issues
- Perform GC
- Click the Perform GC button for manually performing the Garbage Collection(here on referenced as GC)
- While you manually induce the GC, is there any impact in CPU Usage, GC Activity and Memory Usage, is the intention of performing manual GC by clicking Perform GC button
- BTW, What is GC? – The activity of clearing the un-referenced objects in memory
- While you manually induce the GC, is there any impact in CPU Usage, GC Activity and Memory Usage, is the intention of performing manual GC by clicking Perform GC button
- Click the Perform GC button for manually performing the Garbage Collection(here on referenced as GC)
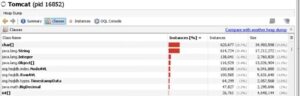
- Heap Dump
-
- It’s a process of taking the memory snapshot while issue, to analyze the reason of the issue
-
- Capture multiple heap dump and analyze and come to an understanding and do the RCA of the issue
- Analyze the behavior of Threads via Threads tab
- We can validate various Thread status like – Running, Sleeping, Waiting, Parked, Monitored Threads
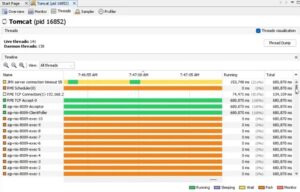
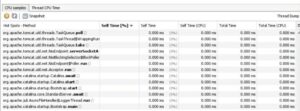
- Analyze the behavior of currently running application’s CPU and Memory data using Sampler and Profiler tabs
- Sampler and Profiler
- Observe the CPU metrics of the backend application’s API(methods)
- Sampler and Profiler
-
-
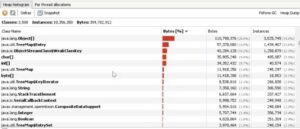
- Observe the Memory metrics of the backend application’s API(methods)
-
-
-
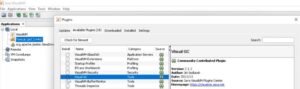
- Also, Leverage the benefits of analyzing the garbage collection metrics with available plugin that comes bundled with Java VisualVM – Visual GC
-
-
-
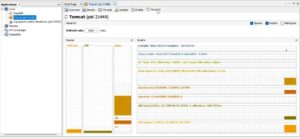
- Once the plugin gets installed, you can monitor the GC metrics produced by Visual GC by clicking on the application name
-
-
JConsole
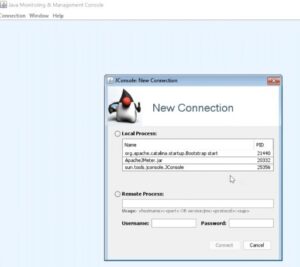
- Select the process that I want to attach/enable JConsole to monitor
-
- The below were the various metrics associated with the Tomcat process that we attached above
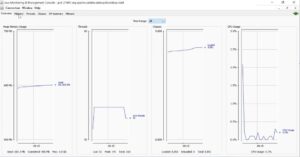
-
- Both JVisualVM and JConsole were intended to monitor JVM, but an added advantage of JConsole is that it’s metrics were analyzed and fetched for a desired time range as below
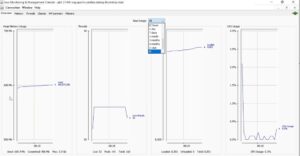
-
- Memory metrics can be analyzed as below
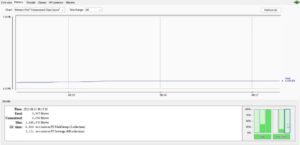
-
- Any Spikes, Exponential Increase in the graph, Memory related errors like OutOfMemory error will be a red flag for you while measuring the performance metrics
- Observe and Analyze the Thread related metrics and issues under the Threads tab
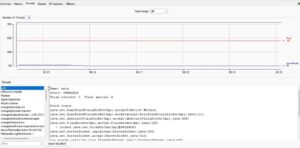
-
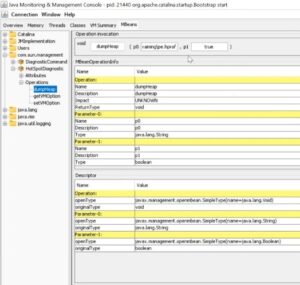
- How to take the heap dump?
-
-
- Navigate to MBeans tab, expand com.sun.management\Operations\dumpHeap, and browse a new file {someFileName.hprof }, and the heap dump gets created
-
-By Saravanan & Sai Krishna

You may also like

Observability and Monitoring – Same or Different?
March 23, 2023

Performance Engineering – JVM Heap Structure
March 15, 2023