
Isha’s Product Training for Dynatrace Software – For Performance Testers, APM Administrators & DevOps Engineers
(APM Platform Architecture, Monitoring Agent, Gateway/Proxy Component, Topology & Dependency Mapping, AI-based Root-Cause Analysis, APM, Real User Monitoring (RUM), Synthetic Monitoring, Distributed Tracing, Logs, Metrics, Data Storage Layer, Query Language (DQL), Kubernetes Monitoring, AWS & Azure Integration, Dashboards, Extensions, APIs & Automation)
This hands-on course runs for 15 days, one hour per day. It teaches you to monitor, troubleshoot and improve modern applications on a leading software intelligence platform. You start with the basics of APM and observability and the three pillars: logs, metrics and traces. From there you move to APM platform architecture (SaaS and Managed), installing the monitoring agent, and the role of the gateway/proxy component. You will learn topology and dependency mapping, service flow and distributed tracing, and how to find response-time hotspots. The course also covers digital experience monitoring, including Real User Monitoring (RUM), Session Replay, Apdex scoring and Synthetic Monitoring with HTTP and browser monitors. Further topics are AI-based root-cause analysis, anomaly detection, the problem lifecycle, alerting profiles, and notification integrations with email, webhooks, Slack, ServiceNow and PagerDuty.
In the advanced modules you work with log ingestion, custom metrics, the data storage layer, and the platform’s query language (DQL) for querying logs, metrics, events and spans. You then turn query results into dashboards, notebooks and service-level objectives (SLOs). You will also learn Kubernetes and OpenShift monitoring, AWS and Azure cloud integration with IAM roles and CloudWatch metrics, extensions, REST APIs, API tokens, configuration as code, workflows and automation. The course ends with an end-to-end APM investigation of a real-world scenario, a shopping application with slow transactions and failed requests. This makes it a good fit for performance engineers, SREs, DevOps engineers, support engineers and testers who want job-ready observability and monitoring skills.
Disclaimer: “Isha Training Solutions is not affiliated with, sponsored or authorized by Dynatrace”
About the Instructor:
|
Sri Vatsa is an experienced technology professional with 8+ years of industry experience, specializing in Application Performance Monitoring (APM) with the DYNATRACE® software product and modern observability practices. He brings strong practical expertise in using APM platforms to monitor applications and infrastructure, analyse performance bottlenecks, identify anomalies, and improve overall application reliability and performance. With 5+ years of training and mentoring experience, Sri Vatsa has successfully trained 1,000+ students and working professionals. With a passion for teaching, mentoring, and knowledge sharing, he focuses on delivering structured, industry-oriented training that combines technical concepts with practical demonstrations. His training approach emphasizes real-world use cases, guided hands-on exercises, and troubleshooting scenarios to help learners understand how APM platforms are used in enterprise environments. His areas of expertise include APM Platform Architecture, Monitoring Agent, Gateway Component, Topology Mapping, AI-based Root-Cause Analysis, Real User Monitoring (RUM), Synthetic Monitoring, Distributed Tracing, Logs, Metrics, the Data Storage Layer, and the Platform Query Language (DQL). He also specializes in Kubernetes Monitoring, AWS and Azure Integrations, Dashboards, Alerting, Extensions, APIs, Workflows, and Custom Apps. Through his practical and learner-focused approach, Sri Vatsa aims to equip learners with the knowledge and skills required to monitor applications, investigate performance issues, analyse observability data, and confidently work with APM platforms in real-world enterprise environments. |
Live Sessions Price:
For LIVE sessions – Offer price after discount is 200 USD 159 99 USD Or USD13000 INR 12900 INR 7900 Rupees.
OR
Free Demo Session:
2nd December @ 9:00 PM – 10:00 PM (IST) (Indian Timings)
2nd December @ 10:30 AM – 11:30 AM (EST) (U.S. Timings)
2nd December @ 3:30 PM – 4:30 PM (GMT) (UK Timings)
Class Schedule:
For Participants in India: Monday to Friday @ 9:00 PM – 10:00 PM (IST)
For Participants in the US: Monday to Friday @ 10:30 AM – 11:30 AM (EST)
For Participants in the UK: Monday to Friday @ 3:30 PM – 4:30 PM (GMT)
What students have to say about Sri Vatsa:
| Sri Vatsa explains APM and observability concepts exceptionally well. His sessions on the monitoring agent, the gateway component, topology mapping and AI-based root-cause analysis helped me understand application monitoring and observability from the fundamentals. – Aarav Sharma
The training was very informative and practical. I particularly enjoyed the query language (DQL) sessions, where Sri Vatsa explained querying logs, metrics and events with easy-to-understand examples. – Sneha Iyer The real-world examples and hands-on demonstrations made this course interesting. Learning distributed tracing, service flow and root-cause analysis gave me a better understanding of application troubleshooting. – Daniel Fernandes Sri Vatsa makes complex technical concepts easy to understand. The sessions on RUM, Synthetic Monitoring, Session Replay and dashboards were especially useful. – Mohd Faizan The end-to-end incident investigation was the highlight of the training. Sri Vatsa demonstrated how to connect application performance, logs, metrics and DQL to investigate issues systematically. – Megha Rao I really liked the industry-oriented approach. The Kubernetes, AWS, Azure and platform automation topics helped me understand the broader observability ecosystem. – Gurpreet Kaur |
What will I learn by the end of this course?
- Explain APM and observability concepts and the three pillars: logs, metrics and traces
- Understand APM platform architecture, including SaaS and Managed deployments
- Install and manage the monitoring agent, and understand the role of the gateway/proxy component
- Use topology and dependency mapping to see how services, processes and hosts are connected
- Follow requests with distributed tracing and service flow to find slow or failing operations
- Set up Real User Monitoring (RUM) and analyse user sessions, Apdex scores and Session Replay
- Configure Synthetic Monitoring with HTTP and browser monitors to test availability ahead of time
- Organise monitored data using tags, management zones, segments and IAM policies
- Use AI-based root-cause analysis and anomaly detection to investigate problems
- Create alerting profiles and send notifications to email, webhooks, Slack, ServiceNow and PagerDuty
- Work with logs, custom metrics and the data storage layer, including retention settings
- Write queries in the platform’s query language (DQL) for logs, metrics, events and spans
- Build dashboards, notebooks and service-level objectives (SLOs) from query results
- Monitor Kubernetes and OpenShift clusters and workloads
- Integrate AWS and Azure cloud services, including IAM role setup and CloudWatch metrics
- Use extensions, REST APIs, API tokens and configuration as code
- Automate operations with workflows and alert-to-notification automation
- Run a complete end-to-end APM investigation on a real-world incident scenario
Salient Features:
- 15+ Hours of Live Training along with recorded videos
- 1 Year Access to Session Recordings
- Course Completion Certificate
Who can enroll in this course?
- Freshers and Beginners – Individuals looking to start a career in application monitoring, observability, and performance engineering.
- Application Support Engineers – Professionals who want to monitor application health, investigate performance issues, and troubleshoot incidents.
- Performance Testers – Professionals interested in expanding their skills from performance testing to application performance monitoring and observability.
- DevOps Engineers – Individuals who want to gain expertise in application monitoring, infrastructure visibility, and automated incident management.
- System Administrators – Professionals looking to monitor servers, processes, infrastructure, and application performance.
- Cloud Engineers – Professionals interested in monitoring AWS, Azure, and cloud-native environments.
- Software Developers – Developers who want to understand application performance, distributed tracing, and production troubleshooting.
- IT Operations and Monitoring Professionals – Individuals who want to enhance their skills in observability, problem management, alerting, and root-cause analysis.
Course syllabus:
Module 1: Getting started — trial, demo environment, monitoring agent and platform tour (4 lessons)
Purpose: Introduce observability and the APM platform, set up both learning environments and make sure each learner can navigate the platform.
- What APM and observability are, and the three pillars
- Activating the 15-day platform trial and the vendor’s free demo environment
- Installing the monitoring agent and verifying the monitored host
- Platform tour: navigating the trial tenant and the demo environment
Hands-on outcome: The learner can access both environments, install the monitoring agent on their laptop and confirm that host data is visible.
Module 2: Architecture and agents (5 lessons)
Purpose: Explain the APM platform architecture and the responsibilities of its main components.
- The APM platform and full-stack monitoring
- Architecture: SaaS and Managed
- Monitoring agent operations: updates and version policy
- Gateway/proxy component: types, roles and when you need one — theory only
- The platform’s AI engine at a glance
Hands-on outcome: The learner can explain the role of the monitoring agent and the gateway component and describe how the platform collects and relates monitoring data.
Module 3: Topology and service observability (5 lessons)
Purpose: Show how the platform discovers monitored entities and helps learners understand application dependencies and service performance.
- Topology and the dependency map
- Processes, process groups and services
- Service flow and backtraces
- Distributed tracing on the demonstration application
- Response-time hotspots and failure analysis
Hands-on outcome: The learner can navigate service topology, follow a request and identify a potential performance bottleneck using available demo data.
Module 4: Digital Experience Monitoring — RUM and Synthetic (5 lessons)
Purpose: Cover both sides of digital experience monitoring in one training session: what real users experience and how synthetic checks proactively test availability and behaviour.
- Digital Experience Monitoring overview: RUM vs Synthetic monitoring
- Real User Monitoring setup: adding the JavaScript tag and viewing user sessions and actions
- User experience analysis: Apdex, bounce rate, session segmentation and mobile RUM
- Session Replay: understanding user behaviour and privacy considerations
- Synthetic monitoring: HTTP monitors, browser monitors, locations, availability and alerting
Hands-on outcome: The learner can explain the difference between RUM and Synthetic monitoring, add the RUM JavaScript snippet to the supplied sample page, inspect user activity and understand how an availability monitor is configured.
Delivery note: Use a one-page sample HTML application for the RUM exercise. Demonstrate browser monitors and private locations where the free environment does not permit learners to configure them. Do not install a gateway component or private location for this exercise.
Module 5: Smart organization (5 lessons)
Purpose: Explain how monitored entities and access can be organized for different teams and use cases.
- Tags and entity metadata
- Management Zones
- Segments
- IAM policies and boundaries
- Management Zones vs Segments vs IAM
Hands-on outcome: The learner can distinguish entity organization from data segmentation and access control, and explain when each is used.
Module 6: Problems and AI root-cause analysis (5 lessons)
Purpose: Teach how the platform detects abnormal behaviour, groups events into problems and helps identify likely root causes.
- Problem lifecycle
- Anomaly detection
- AI-based root-cause analysis
- Simulation: CPU saturation
- Simulation: slow or failing service
Hands-on outcome: The learner can inspect a problem, understand its lifecycle and use available evidence to follow the AI root-cause analysis.
Environment note: The CPU saturation exercise can be performed on a learner laptop with the monitoring agent running, subject to local permissions and system constraints. Use the demo environment’s existing problems for slow or failing service scenarios when a fresh trial tenant does not contain suitable data.
Module 7: Alerting and integrations (5 lessons)
Purpose: Show how detected problems can be turned into actionable notifications and connected to operational tools.
- Alerting profiles
- Problem notifications: email and webhook
- Slack integration
- ServiceNow and PagerDuty integration — instructor demonstration
- Tuning alerts to reduce noise
Hands-on outcome: The learner can explain the alerting flow, configure an available notification route and identify ways to reduce unnecessary notifications.
Module 8: Logs and metrics (5 lessons)
Purpose: Introduce the main forms of telemetry stored and analysed in the platform.
- Metrics basics
- Log Viewer
- Log ingestion and log attributes
- Log metrics and custom metrics
- The data storage layer: storage architecture and retention
Hands-on outcome: The learner can find logs and metrics, understand useful attributes and explain the purpose of the data storage layer and retention settings.
Module 9: Query language (DQL) fundamentals (5 lessons)
Purpose: Introduce the platform’s query language (DQL) and practise querying common observability data.
- Introduction to DQL
- fetch, filter and summarize
- Querying logs
- Querying metrics
- Querying events and spans
Hands-on outcome: The learner can write and interpret basic DQL queries for logs, metrics, events and spans.
Environment note: Use the demo environment as the primary DQL environment because a newly created trial tenant may not yet contain enough varied telemetry. Validate queries against the current supported DQL version before the cohort.
Module 10: Dashboards, Notebooks and SLOs (5 lessons)
Purpose: Teach how query results become operational views and how service objectives can be represented and monitored.
- Intermediate DQL
- Notebooks — demonstrate if enabled in the available environment
- Dashboards: create, share, import, export and clone
- Dashboard tiles from DQL
- Service-level objectives
Hands-on outcome: The learner can create a useful dashboard from DQL results and explain the purpose of an SLO.
Environment note: Verify Notebooks and SLO availability in the trial tenant before the cohort. Use instructor demonstration or the demo environment where learner access is unavailable.
Module 11: Kubernetes monitoring (5 lessons)
Purpose: Introduce how the platform monitors Kubernetes environments and provides visibility into clusters, workloads and applications.
- Kubernetes monitoring and the platform’s Kubernetes Operator
- Kubernetes application and workload views
- OpenShift considerations
- Lab: exploring Kubernetes views in the demo environment
- Practising Kubernetes monitoring independently — prerequisites and next steps
Hands-on outcome: The learner can navigate Kubernetes monitoring views, identify the main monitored entities and explain the information available for clusters and workloads.
Delivery note: This is an instructor-led demonstration and demo-environment exploration. The institute does not provide a Kubernetes cluster. Learners who want to configure their own cluster can follow the post-course prerequisites and self-study guidance.
Module 12: Cloud integration — AWS and Azure (5 lessons)
Purpose: Explain how the platform integrates with major cloud platforms and how cloud telemetry becomes available for investigation.
- AWS integration overview
- AWS role-based integration and IAM role setup
- AWS CloudWatch metrics and services
- Azure integration
- Cloud integration practicals and self-study after the course
Hands-on outcome: The learner can explain the main integration approaches and identify the permissions and cloud-side components required.
Delivery note: AWS role creation and Azure integration are instructor demonstrations unless learners bring their own cloud accounts and suitable permissions. Do not require learners to create paid cloud resources as part of the standard course.
Module 13: Extensions and APIs (5 lessons)
Purpose: Introduce ways to extend the platform, access platform data programmatically and manage configuration through automation.
- Extensions framework: overview and architecture
- Built-in extensions and the extensions library
- API tokens and scopes
- First REST API call
- Configuration as code: overview
Hands-on outcome: The learner can explain the extension model, create an appropriately scoped API token where permitted and perform a basic read-only API request.
Module 14: Workflows, custom apps and automation (5 lessons)
Purpose: Introduce automation capabilities that connect platform data and events to operational actions.
- Workflows: triggers, actions and use cases — instructor demonstration
- Building a simple alert-to-notification workflow — demonstration or hands-on where enabled
- Custom app framework: overview and when to use it
- Custom app walkthrough — instructor demonstration
- Course wrap-up and next steps
Hands-on outcome: The learner can explain where Workflows and the custom app framework fit into the APM platform and describe a simple event-to-notification automation.
Environment note: Verify Workflows and custom app framework availability and permissions in a fresh trial tenant before the cohort. Custom app demonstrations require a suitable SaaS environment with the custom app framework enabled. If unavailable, use a prepared instructor demonstration and explain the limitation.
Module 15: End-to-end APM investigation (5 lessons)
Purpose: Connect the concepts taught throughout the course in one guided operational investigation. This session reinforces practical job skills; it is not an additional formal quiz session.
- Understanding the incident: business and application impact
- Investigating topology, service flow and end-to-end transaction traces
- Using Problems and AI root-cause analysis to identify likely root causes
- Validating findings with logs, metrics, DQL and dashboards
- Alerting, notifications and presenting the investigation
Investigation scenario: A shopping application experiences slow transactions and failed requests.
The learner is guided to:
- Identify the affected services and understand the impact.
- Inspect topology and service flow.
- Follow traces and identify slow or failing operations.
- Inspect relevant logs and metrics.
- Use Problems and AI root-cause information as supporting evidence.
- Validate the suspected cause with DQL or dashboard data.
- Explain the recovery and monitoring approach.
Environment note: Use the pre-populated demo environment for existing problems, services, traces and RUM data. Use the personal trial for actions such as creating a dashboard, alert profile or notification where appropriate. Do not imply that the learner has fixed a real production system; this is a guided training investigation.
How can I enroll for this course?
OR
Call or whatsapp Kumar Gupta on +91- 9133190573 to enroll for free demo
Live Sessions Price:
For LIVE sessions – Offer price after discount is 200 USD 159 99 USD Or USD13000 INR 12900 INR 7900 Rupees.
Frequently Asked Questions (FAQs)
1. What is Dynatrace, and why should I learn it?
Dynatrace is an observability and application performance monitoring platform that helps organizations monitor applications, infrastructure, user experiences, and cloud environments. Learning Dynatrace can help you build skills in application monitoring, performance analysis, troubleshooting, and observability.
2. Who can enroll in this Dynatrace training course?
Freshers, IT professionals, application support engineers, performance testers, DevOps engineers, system administrators, cloud engineers, and software developers interested in learning Dynatrace and observability can enroll.
3. Do I need prior Dynatrace experience to join this course?
No. This course starts with observability fundamentals and introduces Dynatrace concepts step by step. Prior Dynatrace experience is not required.
4. What are the prerequisites for this course?
Basic knowledge of IT infrastructure, applications, operating systems, or software development is beneficial. However, beginners can also join the training.
5. What topics will be covered in the training?
The course covers APM platform fundamentals, architecture, the monitoring agent, the gateway component, topology mapping, RUM, Synthetic Monitoring, distributed tracing, problem management, logs, metrics, the data storage layer, DQL, dashboards, Kubernetes, AWS, Azure, APIs, extensions, workflows, and custom apps.
6. Will this course include hands-on practical sessions?
Yes. The training includes guided demonstrations and hands-on exercises using Dynatrace Playground and trial environments to help learners understand real-world monitoring and troubleshooting scenarios.
7. Will I learn Dynatrace Query Language (DQL)?
Yes. You will learn DQL fundamentals, including fetching, filtering, summarizing, and analysing logs, metrics, events, and spans. You will also explore intermediate DQL and dashboard creation.
8. Will I learn application performance monitoring and troubleshooting?
Yes. You will learn how to monitor applications, analyse service performance, explore distributed traces, identify performance bottlenecks, investigate problems, and understand potential root causes using AI.
9. Does the course cover Kubernetes and cloud monitoring?
Yes. The curriculum includes Kubernetes and OpenShift monitoring, AWS integrations, Azure integrations, AWS IAM roles, and CloudWatch metrics.
10. Will I learn about Dynatrace automation and integrations?
Yes. You will explore alerting, Slack, ServiceNow, PagerDuty, REST APIs, Extensions 2.0, Workflows, and AppEngine.
11. How long is the Dynatrace training course?
The course is structured for 15 training days, with one hour of training per day, covering 15 modules and 74 lessons.
12. Will I work on real-world scenarios during the training?
Yes. The course includes practical demonstrations and an end-to-end application investigation involving slow transactions, failed requests, service dependencies, logs, metrics, and root-cause analysis.
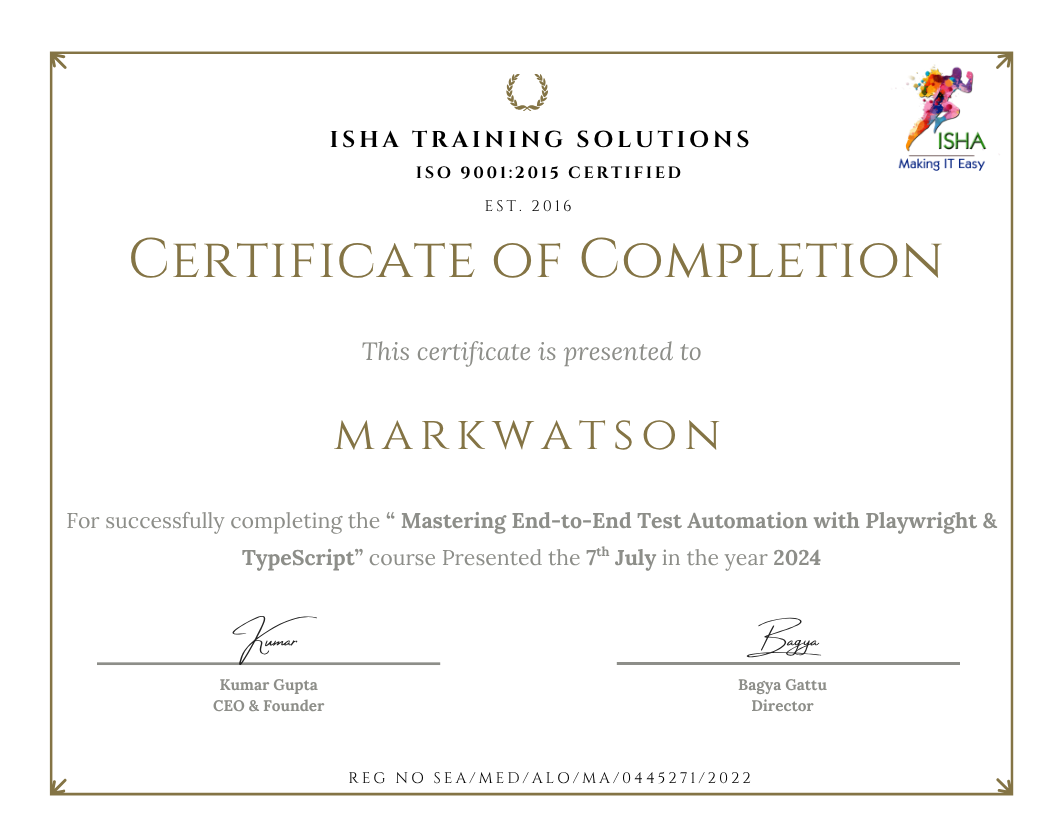
Sample Course Completion Certificate:
Your course completion certificate looks like this……
Course Policy :
- Once payment is made, no refund will be provided.
- If you do not attend the course, the payment cannot be transferred to another batch.
- Course repetition is not allowed for missed sessions.
- We request all learners to attend the scheduled sessions regularly and make the most of their learning journey. Thank you for your understanding and continued support.
Course Features
- Lectures 74
- Quiz 0
- Duration 15 hours
- Skill level All levels
- Students 2900
- Assessments Yes
- 15 Sections
- 74 Lessons
- 15 Hours
- Module 1: Getting started — trial, demo environment, monitoring agent and platform tour (4 lessons)4 Items
- Module 2: Architecture and agents (5 lessons)5 Items
- Module 3: Topology and service observability (5 lessons)5 Items
- Module 4: Digital Experience Monitoring — RUM and Synthetic (5 lessons)5 Items
- 4.1Digital Experience Monitoring overview: RUM vs Synthetic monitoring
- 4.2Real User Monitoring setup: adding the JavaScript tag and viewing user sessions and actions
- 4.3User experience analysis: Apdex, bounce rate, session segmentation and mobile RUM
- 4.4Session Replay: understanding user behaviour and privacy considerations
- 4.5Synthetic monitoring: HTTP monitors, browser monitors, locations, availability and alerting
- Module 5: Smart organization (5 lessons)5 Items
- Module 6: Problems and AI root-cause analysis (5 lessons)5 Items
- Module 7: Alerting and integrations (5 lessons)5 Items
- Module 8: Logs and metrics (5 lessons)5 Items
- Module 9: Query language (DQL) fundamentals (5 lessons)5 Items
- Module 10: Dashboards, Notebooks and SLOs (5 lessons)5 Items
- Module 11: Kubernetes monitoring (5 lessons)5 Items
- Module 12: Cloud integration — AWS and Azure (5 lessons)5 Items
- Module 13: Extensions and APIs (5 lessons)5 Items
- Module 14: Workflows, custom apps and automation (5 lessons)5 Items
- 14.1Workflows: triggers, actions and use cases — instructor demonstration
- 14.2Building a simple alert-to-notification workflow — demonstration or hands-on where enabled
- 14.3Custom app framework: overview and when to use it
- 14.4Custom app walkthrough — instructor demonstration
- 14.5Course wrap-up and next steps
- Module 15: End-to-end APM investigation (5 lessons)5 Items
- 15.1Understanding the incident: business and application impact
- 15.2Investigating topology, service flow and end-to-end transaction traces
- 15.3Using Problems and AI root-cause analysis to identify likely root causes
- 15.4Validating findings with logs, metrics, DQL and dashboards
- 15.5Alerting, notifications and presenting the investigation