
Observability Engineering From Beginner to Master – Live Training
(Prometheus, PromQL, Grafana, ELK Stack, OpenTelemetry, Jaeger, Alertmanager, SLI/SLO, Error Budgets & Incident Management)
Master modern Observability Engineering through practical online live training. This course covers the complete observability lifecycle, including metrics, logs, distributed traces, monitoring, alerting, and troubleshooting. You will gain hands-on experience with Prometheus, PromQL, Grafana, ELK Stack, OpenTelemetry, Jaeger, and Alertmanager, while learning how to instrument applications, build dashboards, centralize logs, implement distributed tracing, and create effective alerts.
The course focuses on applying observability to real-world application monitoring and incident investigation scenarios. You will learn SLIs, SLOs, SLAs, error budgets, burn rates, incident investigation, root cause analysis, performance troubleshooting, dependency failures, and availability issues. Through hands-on exercises and a final capstone project, you will design and operate an end-to-end observability platform and use metrics, logs, and traces together to investigate and resolve production-style application and infrastructure issues.
About the Instructor:
|
Pandit is an experienced technology professional with 10+ years of industry experience, specializing in Observability, SRE, Azure Cloud, Kubernetes, monitoring, and modern production systems. He has practical experience working with complex applications, microservices, cloud environments, and production systems where reliability, performance, monitoring, and troubleshooting are critical. His technical expertise includes Prometheus, Grafana, ELK Stack, OpenTelemetry, Jaeger, Alertmanager, Kubernetes, Azure Cloud, SRE practices, SLI/SLO, error budgets, incident management, and Root Cause Analysis (RCA). His experience spans application and infrastructure monitoring across cloud and on-premises environments, with a strong focus on observability, production troubleshooting, performance monitoring, and reliability engineering. As a trainer and technology mentor, Pandit focuses on practical, real-world learning through hands-on exercises, troubleshooting scenarios, and production-oriented use cases. He has trained and mentored 200+ students and professionals, helping learners understand metrics, logs, distributed tracing, alerting, SLOs, incident investigation, performance issues, and RCA. His practical teaching approach enables learners to apply Observability and SRE practices effectively in real-world engineering environments. |
Live Sessions Price:
For LIVE sessions – Offer price after discount is 300 USD 259 99 USD Or USD13000 INR 12900 INR 7900 Rupees
OR
Free Demo Session:
Indian Timings: 22nd October @ 9 PM – 10 PM (IST)
U.S Timings: 22nd October @ 11:30 AM – 12:30 PM (EST)
UK Timings: 22nd October @ 4:30 PM – 5:30 PM (BST)
Class Schedule:
For Participants in India: Every Monday to Friday @ 9 PM – 10 PM (IST)
For Participants in US: Every Monday to Friday @ 11:30 AM – 12:30 PM (IST)
For Participants in UK: Every Monday to Friday @ 4:30 PM – 5:30 PM (IST)
What student’s have to say about Pandit:
| Very practical training. The Prometheus and Grafana sessions were really useful. — Rahul Good course with a clear explanation of observability fundamentals, metrics, logs, and traces. The hands-on sessions made the concepts easier to understand. The OpenTelemetry and Jaeger sessions were excellent. I understood how traces and spans work and how they can help in troubleshooting application issues. The course was well structured and covered Prometheus, Grafana, ELK Stack, OpenTelemetry, Alertmanager, and SLO concepts. The practical exercises gave me good exposure to the tools. I particularly liked the incident investigation and RCA sessions. We worked through application failures, latency problems, and dependency issues, which made the training feel closer to real production scenarios. The trainer also explained the troubleshooting approach clearly. This was a very useful Observability and SRE training. We started with the fundamentals and gradually moved into metrics, centralized logging, distributed tracing, alerting, SLI/SLO, and error budgets. The hands-on work with Prometheus, Grafana, ELK, OpenTelemetry, and Jaeger helped me understand how the different components fit together. The final capstone was especially useful because it brought the concepts together in an end-to-end project. |
Who can enroll for this course?
- DevOps Engineers looking to master modern observability, monitoring, logging, and alerting.
- SRE Engineers looking to strengthen reliability engineering and incident management skills.
- Cloud & Infrastructure Engineers working with application and infrastructure monitoring.
- Backend Developers who want to implement metrics, logs, distributed tracing, and application observability.
- Platform Engineers responsible for building reliable and observable platforms.
- Performance Engineers interested in using observability for latency and performance analysis.
- Production Support Engineers looking to improve troubleshooting, incident investigation, and RCA skills.
- QA & Automation Engineers who want to understand application monitoring, failures, performance, and observability.
What will I Learn by end of this course?
- Design an end-to-end observability architecture
- Implement Metrics, Logs and Distributed Tracing
- Build centralized logging and monitoring platforms
- Instrument applications using OpenTelemetry
- Develop operational dashboards and alerts
- Define and monitor SLIs and SLOs
- Implement error-budget concepts
- Correlate metrics, logs and traces for troubleshooting
- Perform incident investigation and Root Cause Analysis
- Develop observability runbooks
- Build and present a complete production-oriented observability project
Salient Features:
- 35 Hours of Live Training along with recorded videos
- 1 Year access to the recorded videos
- Course Completion Certificate
Course syllabus:
Module 1 — Observability Fundamentals & Metrics
- Introduction to Observability and Monitoring
- Observability pillars: Metrics, Logs and Traces
- Monitoring vs Observability
- Key Observability concepts and terminology
- Application instrumentation fundamentals
- Structured application logging
- Prometheus fundamentals
- Metrics collection and querying with PromQL
- Grafana dashboards and visualization
Hands-on:
- Instrument and monitor a Python/FastAPI application
- Build application and infrastructure monitoring dashboards
Module 2 — Centralized Logging with ELK Stack
- Logging architecture and centralized logging
- Elasticsearch fundamentals
- Logstash fundamentals and pipeline architecture
- Filebeat and log collection
- Log parsing, filtering and enrichment
- Structured JSON logging
- Elasticsearch indexing and querying
- Kibana dashboards and log visualization
- Log-based troubleshooting and investigation
Hands-on:
- Build an end-to-end centralized logging pipeline
- Create operational log dashboards
Module 3 — OpenTelemetry & Distributed Tracing
- Distributed systems and tracing fundamentals
- Trace, Span, Trace ID and Span ID
- Parent-child span relationships
- Context propagation
- OpenTelemetry architecture and components
- OpenTelemetry SDK and application instrumentation
- Automatic and manual instrumentation
- OpenTelemetry Collector architecture
- OTLP and telemetry pipelines
- Jaeger for distributed trace visualization
- Trace attributes and metadata
- Correlating traces with application logs
Hands-on:
- Instrument a FastAPI application with OpenTelemetry
- Deploy OpenTelemetry Collector and Jaeger
- Investigate application latency and failures using traces
Module 4 — Alerting, SRE & Service Level Objectives
- Observability-driven alerting
- Alert design and alert severity
- Prometheus alert rules
- Alert lifecycle: Inactive, Pending and Firing
- Alertmanager architecture
- Alert routing, grouping, silencing and deduplication
- Grafana alerting concepts
- Service Level Indicators (SLIs)
- Service Level Objectives (SLOs)
- Service Level Agreements (SLAs)
- Error budgets
- Error-budget consumption and burn rate
- SLO-based alerting strategies
Hands-on:
- Build application and latency alerts
- Configure Alertmanager
- Define SLI/SLO and calculate error budgets
Module 5 — End-to-End Observability Capstone & Incident Management
- End-to-end observability architecture
- Observability-driven incident response
- Metrics → Logs → Traces investigation methodology
- Cross-signal correlation using Trace IDs
- Root Cause Analysis (RCA)
- Incident investigation methodology
- Troubleshooting application failures
- Troubleshooting latency and performance issues
- Troubleshooting downstream dependency failures
- Application availability and outage investigation
- Observability runbooks
- Incident documentation and reporting
- Observability architecture documentation
Hands-on:
- Realistic incident simulation exercises
- End-to-end troubleshooting and RCA
- Capstone: Design and operate a complete observability platform
- Final project presentation and assessment
Technology Stack:
- Python / FastAPI
- Docker & Docker Compose
- Prometheus
- Grafana
- Elasticsearch
- Logstash
- Filebeat
- Kibana
- OpenTelemetry
- OpenTelemetry Collector
- Jaeger
- Alertmanager
- PromQL
How can I enroll for this course?
OR
For any other details, Call me or Whatsapp me on +91-9133190573
Live Sessions Price:
For LIVE sessions – Offer price after discount is 300 USD 259 99 USD Or USD13000 INR 12900 INR 7900 Rupees
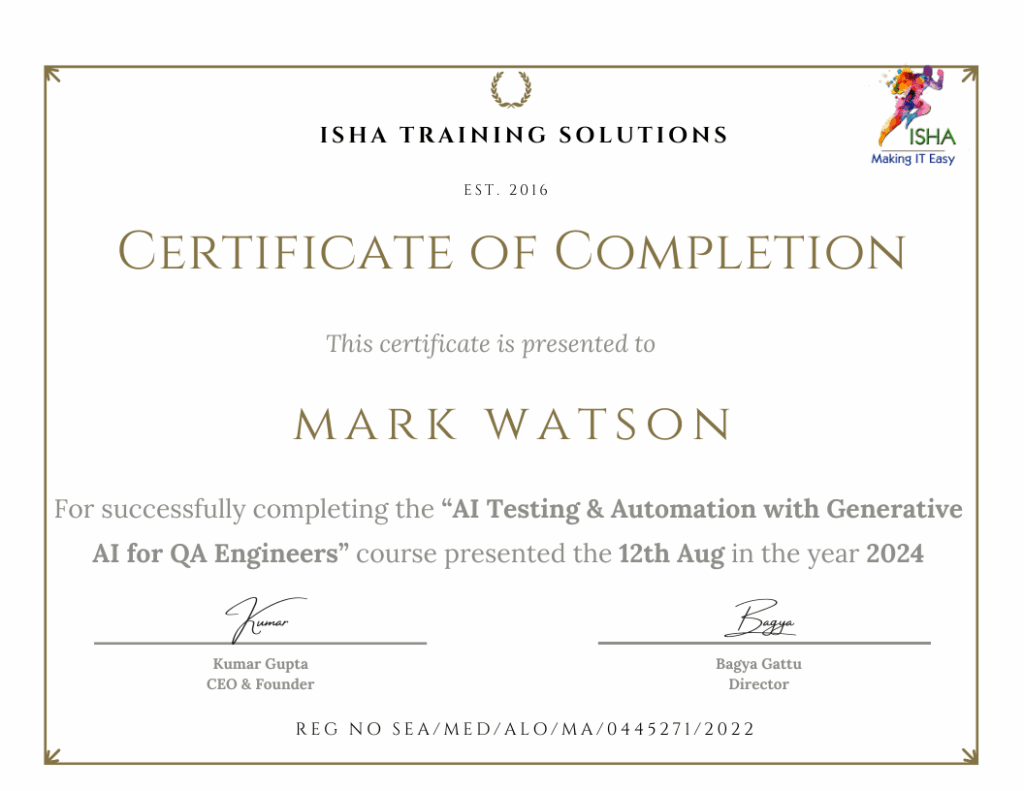
Sample Course Completion Certificate:
Your course completion certificate looks like this….
Important Note:
To maintain the quality of our training and ensure a smooth learning experience for all participants, we do not allow batch repetition or switching between courses.
To reiterate, moving from one course to another or shifting from one trainer to another (even if it is the same course) is not possible. Changing batches or trainers in any form is strictly not permitted.
We request all learners to attend the scheduled sessions regularly and make the most of their learning journey. Thank you for your understanding and continued support.