
Apache JMeter Performance Testing Course with CI/CD, Dynatrace ,Groovy & Grafana – Live Training
(Master end-to-end performance testing with Apache JMeter with Groovy, REST API, GraphQL, CI/CD, Jenkins, GitHub Actions, Docker, Kubernetes, Grafana, InfluxDB, Dynatrace Distributed Testing & CI/CD Pipelines)
Master Apache JMeter Performance Testing with our comprehensive, industry-focused live training program designed for aspiring Performance Test Engineers and experienced QA professionals. This course provides in-depth knowledge of performance engineering concepts, JMeter architecture, scripting, parameterization, correlation, REST API testing, advanced Groovy scripting, distributed load testing, and performance analysis. Through practical labs and real-world scenarios, you’ll gain the skills to design, execute, and optimize enterprise-grade performance tests with confidence.
The program also covers modern performance engineering practices, including CI/CD integration with Jenkins and GitHub Actions, monitoring using Grafana and Dynatrace, Docker and Kubernetes-based load testing, and enterprise reporting. With hands-on projects, a real-time capstone, interview-focused guidance, and expert mentor support, you’ll develop the practical expertise needed to deliver high-performing, scalable, and reliable applications in real-world enterprise environments.
About The Instructor:
|
Visvashwarr is a Performance Engineering expert with over 11 years of industry experience in designing, executing, and optimizing enterprise-scale performance testing solutions. He has worked across diverse domains, including Enterprise SIEM platforms, Web Applications, REST & SOAP APIs, Oracle Retail Applications, ETL Batch Processing, and Messaging Queue (MQ) systems, helping organizations build scalable, reliable, and high-performing applications. His expertise includes Apache JMeter, LoadRunner, Performance Engineering, API Performance Testing, Groovy Scripting, Dynatrace, AppDynamics, Grafana, CI/CD Integration, Docker, Kubernetes, Jenkins, AWS, and Oracle Cloud. He has extensive experience in identifying and resolving complex performance bottlenecks such as memory leaks, JVM heap issues, garbage collection overhead, thread contention, response time degradation, load balancing, and high-availability challenges. With 5+ years of professional training experience, Vishweshwar has successfully trained 300+ students and working professionals through instructor-led, hands-on training programs. His practical teaching methodology combines real-world projects, live demonstrations, performance analysis techniques, and interview-focused guidance, enabling learners to gain industry-ready skills. Throughout this course, he shares practical insights, real-world case studies, and proven best practices, helping participants confidently execute enterprise-level Performance Engineering projects and accelerate their careers in Performance Testing and Performance Engineering. |
Live Sessions Price:
For LIVE sessions – Offer price after discount is 200 USD 159 109 USD Or USD15000 INR 13000 INR 8900 Rupees.
OR
Free Demo Session:
27th October @ 8:00 PM – 9:00 PM (IST) (Indian Timings)
27th October @ 11:30 AM – 12:30 PM (EDT) (U.S. Timings)
27th October @ 3:30 PM – 4:30 PM (BST) (UK Timings)
Class Schedule:
For Participants in India: Monday to Friday @ 8:00 PM – 9:00 PM (IST)
For Participants in the US: Monday to Friday @ 11:30 AM – 12:30 PM (EDT)
For Participants in the UK: Monday to Friday @ 3:30 PM – 4:30 PM (BST)
Note for US & UK students — Daylight Saving Time ends on 25th Oct (UK) and 1st Nov 2026 (US). UK classes run at 2:30 – 3:30 PM (GMT); from 1st Nov US classes run at 9:30 – 10:30 AM (EST). India stays the same (8 – 9 PM IST).
What student’s have to say about Trainer :
|
⭐ The course focuses on real-world performance testing challenges rather than just theory. I gained confidence in creating scalable JMeter scripts, analyzing bottlenecks, and generating professional performance reports.” – Anjali. ⭐ An ideal course for anyone looking to build a successful career in JMeter – Rahul. ⭐ This course helped me build production-ready JMeter scripts and improve my performance engineering skills.– Priya. ⭐ I gained practical experience in identifying performance bottlenecks, analyzing reports, and optimizing application performance. The hands-on approach made learning both engaging and effective. This is one of the best JMeter training programs available. – Mohammed. ⭐ Very interactive and engaging sessions. Trainer focuses on practical implementation, which helped me prepare for interviews and real-time projects. – Neha. ⭐ I was impressed by the depth of the course and the focus on real-time enterprise scenarios. From JMeter fundamentals to advanced Groovy scripting and observability tools, every topic was covered thoroughly. The live demonstrations made complex concepts easy to understand. The hands-on exercises boosted my confidence in handling production workloads. I would strongly recommend this course to aspiring Performance Engineers. – Suresh. |
What will I Learn by end of this course?
- Build correlated, parameterised JMeter scripts with Groovy HMAC signing
- Write advanced Groovy: HMAC crypto, file I/O, token refresh, error budgets
- Run distributed tests across multiple machines or K8s pods
- Stream live metrics to Grafana + InfluxDB during test execution
- Build Jenkins pipelines with performance gates and trend analysis
- Write GitHub Actions workflows with PR comments and matrix environments
- Annotate Dynatrace with JMeter test runs via the Events API
- Query Dynatrace Davis AI problems API and auto-abort on HIGH severity
- Build SLO-gated promotion pipelines with zero human approval
- Produce executive-ready reports and stakeholder presentations
Salient Features:
- 32 Hours of Live Training along with recorded videos
- 1 Year access to the recorded videos
- Course Completion Certificate
Who can enroll in this course?
- Software Test Engineers (Manual & Automation)
- Performance Test Engineers and Performance Engineers
- QA Engineers and QA Leads
- SDET (Software Development Engineers in Test)
- API Testing Professionals
- DevOps and CI/CD Engineers
- Site Reliability Engineers (SREs)
- Developers interested in Performance Engineering
- System Administrators and Infrastructure Engineers
- Freshers and graduates looking to build a career in Performance Testing
- Professionals preparing for Performance Testing and Performance Engineering interviews
- Anyone who wants to master Apache JMeter with real-world enterprise projects and industry best practices
Course syllabus:
- Load · Stress · Spike · Soak · Endurance
- NFRs and SLAs
- Apdex score
- JMeter vs LoadRunner vs k6
- One thread = one virtual user
- -Xms / -Xmx heap sizing
- jmeter.properties vs user.properties
- Execution order: Pre → Sampler → Post → Assert
- Thread Group / Sampler / Controller / Listener
- Config Elements & scope rules
- Proxy recorder setup (port 8888)
- HTTPS certificate installation
- Filtering CSS / JS / images
Session 5: Thread Groups & Load Shape Basics
Thread count, ramp-up, duration, think time, and the throughput vs concurrency mental model.
- Thread count vs Ramp-up vs Duration
- Loop Count vs Scheduler
- Constant / Uniform / Gaussian Timer
Phase 2: Scripting Mastery (incl. Groovy Deep-Dive) (Sessions 6–14 · Build production-grade, parameterised, correlated scripts — with full Groovy mastery)
- Regular Expression Extractor
- JSON Extractor (JSONPath / JMESPath)
- XPath 2.0 · Boundary Extractor
Session 7: Parameterisation & Data-Driven Testing
CSV Data Set Config, sharing modes, recycle strategies, and built-in functions for unique data.
- CSV Data Set Config — all options
- Sharing modes: All Threads / Thread
- __RandomString · __UUID · __counter
Session 8: Assertions & Validation
- Response Assertion
- JSON Assertion
- Duration Assertion (SLA enforcement)
- JSR223 Assertion (Groovy)
- Lab: Validate API Response Schema
Session 9: Controllers — Logic & Flow
- If · While · Loop Controller
- Transaction Controller
- Throughput Controller (traffic splits)
- JSR223 PreProcessor (Groovy)
- JSR223 PostProcessor
- HTTP Header Manager · Cookie Manager
- def / GString / GDK methods
- vars · props · log · prev · ctx · sampler
- collect · findAll · inject · each
- ?. operator · Elvis ?: · null safety
- HttpURLConnection from Groovy
- HMAC-SHA256 + Base64 signing
- File.text · readLines · append
- Compiled script caching — static vars only
- Token refresh on 401 via If Controller
- JsonBuilder — nested dynamic payloads
- JsonSlurper schema validation
- AtomicInteger error budget counter
- HTTP verbs: GET POST PUT PATCH DELETE
- GraphQL over HTTPOAuth 2.0 client_credentials & password grant
- Summary vs Aggregate Report
- JTL file — every column explained
- HTML Dashboard Report
- jmeter -n -t -l -e -o
- -Jpropname=value runtime overrides
- ${__P(propname, default)}
- RMI port & remote_hosts config
- CSV partitioning across workers
- Result aggregation
- P90 / P95 / P99 — which to use when
- Throughput plateau = saturation signal
- Apdex score · Concurrency curve
- Backend Listener → InfluxDB
- Grafana dashboard ID 5496
- Alert rules on P95 breach
- GC pause correlation with P99 spikes
- DB connection pool exhaustion pattern
- Concurrency Thread Group (JP@GC)
- Arrivals Thread Group (RPS-based)
- Throughput Shaping Timer · Flash-sale patterns
- JMeter Plugin Manager
- WebSocket Sampler
- JDBC Request Sampler + Connection Config
- Flat vs waterfall latency signatures
- Thread dump analysis
- Kubernetes Data Flow Architecture
- Kubernetes Components: Pod, Container, Node, vCPU, etc.
- Understanding Pod-to-Node Data Flow
- Analyze Kubernetes Logs for troubleshooting
- Pod Restart Analysis — Reasons and common causes
- Troubleshooting Pod Failures and Restarts
- NFR gathering template
- Executive summary: one page, clear verdict
- Pass/fail criteria framing
- Jenkins Performance Plugin
- Jenkinsfile declarative pipeline
- errorFailedThreshold · relativeFailedThresholdPositive
- Build trend analysis across 10 builds
- Dynatrace Architecture & Core Components
- OneAgent and Monitoring Overview
- Synthetic Monitoring — Basics and Use Cases
- PurePath Live Analysis — End-to-End Request Tracing
- JMeter Node Integration with Dynatrace
- Analyze JMeter Performance Data in Dynatrace
- Davis AI — AI-Assisted Performance Analysis & Insights
- Performance requirements gathering from a bare URL and project manager’s email
- Kickoff meeting, API discovery, and curl-based API confirmation
- Build a production-grade JMeter script from scratch
- Configure 500 parameterised users using CSV data
- JWT correlation with automatic token refresh
- Groovy PreProcessor to calculate transfer amounts from live balance data
- 20% Throughput Controller for transaction history
- Synchronized error budget to stop the test cleanly at 50 failures
- Duration Assertions to enforce performance NFRs
- Validate the test with 1 user, ramp to 50 users, and execute at 200 users
- Identify connection pool bottlenecks during load execution
- Analyze error-budget failures during the test
- Use the JMeter HTML Report to confirm performance issues and root causes
- Deliver production-ready performance test results suitable for developer handoff
How can I enroll for this course?
OR
For any other details, Call me or Whatsapp me on +91-9133190573
Live Sessions Price:
For LIVE sessions – Offer price after discount is 200 USD 159 109 USD Or USD15000 INR 13000 INR 8900 Rupees.
FAQ –Apache JMeter Performance Testing Course with CI/CD, Dynatrace & Grafana:
1️⃣ Who can enroll in this course?
This course is ideal for Manual Testers, Automation Test Engineers, Performance Test Engineers, QA Professionals, Developers, DevOps Engineers, SREs, and freshers who want to build expertise in Performance Engineering.
2️⃣ Do I need prior experience with Apache JMeter?
No. The course starts with JMeter fundamentals and gradually progresses to advanced enterprise-level topics, making it suitable for both beginners and experienced professionals.
3️⃣ What tools and technologies will I learn?
You will learn Apache JMeter, Groovy, REST API Performance Testing, Grafana, Dynatrace, Docker, Kubernetes, Jenkins, GitHub Actions, CI/CD, and enterprise performance engineering practices.
4️⃣ Is this course practical or theory-based?
The training is highly practical, with hands-on labs, real-world assignments, enterprise use cases, and a capstone project to reinforce your learning.
5️⃣ Will I work on real-time projects?
Yes. The course includes real-world performance testing scenarios and an enterprise capstone project to help you gain practical experience.
6️⃣ Will I receive a course completion certificate?
Yes. A Course Completion Certificate will be awarded after successfully completing the training.
7️⃣ Are session recordings provided?
Yes. Recorded sessions will be available so you can revisit the lessons anytime for revision.
8️⃣ Will this course help me prepare for interviews?
Absolutely. The course includes interview-focused guidance, practical exercises, and industry best practices to help you confidently attend Performance Testing and Performance Engineering interviews.
9️⃣ What career opportunities can I pursue after this course?
You can apply for roles such as Performance Test Engineer, Performance Engineer, QA Engineer, SDET, DevOps Engineer, and Site Reliability Engineer (SRE).
🔟 Will I get support after the training?
Yes. You will receive mentor support, guidance for practical exercises, and assistance with your learning throughout the course.
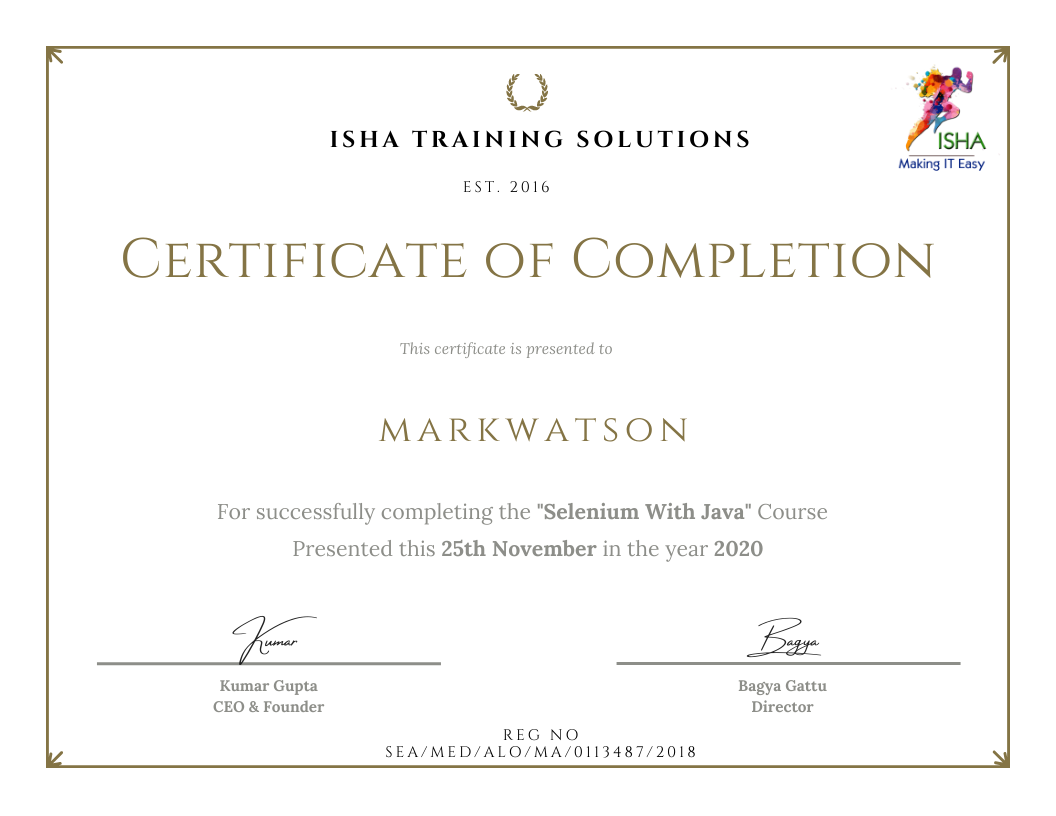
Sample Course Completion Certificate:
Your course completion certificate looks like this……
Note:
To maintain the quality of our training and ensure a smooth learning experience for all participants, we do not allow batch repetition or switching between courses.
To reiterate, moving from one course to another or shifting from one trainer to another (even if it is the same course) is not possible. Changing batches or trainers in any form is strictly not permitted.
We request all learners to attend the scheduled sessions regularly and make the most of their learning journey. Thank you for your understanding and continued support.
Course Features
- Lectures 32
- Quiz 0
- Duration 32 hours
- Skill level All levels
- Language English
- Students 0
- Assessments Yes
- 6 Sections
- 32 Lessons
- 32 Hours
- Foundations & Core Concepts5
- Scripting Mastery (incl. Groovy Deep-Dive)9
- 2.1Correlation — The #1 Scripting Skill
- 2.2Parameterisation & Data-Driven Testing
- 2.3Assertions & Validation
- 2.4Controllers — Logic & Flow
- 2.5Pre & Post Processors
- 2.6Groovy Scripting — Language Essentials EXPANDED
- 2.7Groovy Scripting — Advanced Patterns NEW
- 2.8Groovy Scripting — Real-World Recipes NEW
- 2.9REST API, GraphQL & OAuth 2.0 Testing
- Execution, Monitoring & Analysis6
- Advanced Topics5
- CI/CD & Dynatrace Integration6
- 5.1CI/CD Part 1 — Jenkins Pipeline Integration NEW
- 5.2CI/CD Part 2 — GitHub Actions & Azure DevOps NEW
- 5.3CI/CD Part 3 — Advanced Pipeline Patterns NEW
- 5.4Dynatrace Integration Part 1 — OneAgent & PurePath NEW
- 5.5Dynatrace Integration Part 2 — Davis AI & Problem Detection NEW
- 5.6Dynatrace + CI/CD — Full Integrated Pipeline NEW
- Real-World Mastery & Capstone1


