
“Mastering Datadog: Complete Observability, Monitoring, APM & Security Platform Training”
This comprehensive course is designed to help DevOps engineers, SREs, cloud architects, and system administrators master Datadog, the leading cloud-based observability platform. From infrastructure monitoring and log management to application performance monitoring (APM), real user monitoring (RUM), and cloud security, this course covers every major feature of Datadog through real-world use cases and hands-on labs.
You’ll learn how to install and configure the Datadog Agent, build interactive dashboards, create intelligent monitors and alerts, and instrument your applications for deep performance insights. You’ll also explore integrations with cloud providers (AWS, Azure, GCP), containers (Docker, Kubernetes), and CI/CD pipelines.
By the end of this course, you will be equipped to implement full-stack monitoring and observability solutions in production environments using Datadog.
About The Instructor:
|
Vasavi is an experienced DevOps and Cloud Monitoring expert with hands-on expertise in implementing Datadog across multi-cloud environments (AWS, Azure, GCP). She has successfully helped engineering teams deploy full-stack observability using Datadog, covering infrastructure monitoring, APM, log management, and real-user monitoring (RUM). With over X years of experience (you can fill this in), Vasavi has worked on instrumenting microservices using Datadog APM, setting up advanced alerting strategies, and integrating Datadog with CI/CD pipelines (GitHub, Jenkins). She brings real-world project insights, including Kubernetes monitoring, cloud cost tracking, and cloud security posture monitoring, making her sessions highly practical and industry-focused. |
Live Sessions Price:
For LIVE sessions – the offer price after discount is 200 USD 159 120 USD Or USD13000 INR 9900 INR 9,000 Rupees.
OR
Free Demo Session:
Indian Timings: 1st July @ 9:00 PM – 10:00 PM (IST)/
U.S Timings: 1st July @ 11:30 AM – 12:30 PM (EST)/
U.K Timings:1st July @ 4:30 PM – 5:30 PM (BST).
Class Schedule:
For Participants in India: Monday to Friday 9 PM – 10 PM (IST)
For Participants in US: Monday to Friday 11:30 AM – 12:30 PM (EST)
For Participants in UK: Monday to Friday 4:30 PM – 5:30 PM (BST)
What students have to say about the Trainer :
| “Vasavi Ma’am made Datadog so simple and hands-on. I was able to set up real-time monitoring and dashboards within the first week. Her explanations are very clear, and she always shares practical use cases.” — Rahul S., DevOps Engineer “I had zero experience in observability tools, but Vasavi’s training helped me confidently work with Datadog APM and logs. The sessions were highly interactive, and she answered every question with patience.” “Her approach is practical, industry-focused, and easy to follow. The hands-on labs and real project scenarios gave me confidence to use Datadog in my current job.” “Vasavi is not just a trainer—she’s a mentor. She explains even complex integrations like Kubernetes monitoring and custom metrics in a way that beginners can understand. Highly recommend her course!” |
Salient Features:
- 20+ hours of Live Training along with recorded videos
- Lifetime access to the recorded videos
- Course Completion Certificate
Who can enroll in this course?
- DevOps Engineers – Looking to integrate Datadog for end-to-end monitoring
- Site Reliability Engineers (SREs) – To gain full-stack observability and incident response skills
- Cloud Engineers & Architects – Who manage AWS, Azure, or GCP services
- System Administrators – Who want better infrastructure and server monitoring
- Application Developers – To trace and optimize app performance using Datadog APM
- QA/Automation Engineers – Interested in synthetic monitoring and real user monitoring (RUM)
- Students or Career Switchers – Seeking a career in DevOps or Cloud Monitoring
What will I learn by the End of this course?
By the end of this Mastering Datadog course, you will be fully equipped to implement, manage, and optimize monitoring and observability solutions across your infrastructure, applications, and cloud environments.
You will be able to:
- Install and Configure the Datadog Agent on servers, containers, and Kubernetes clusters
- Monitor infrastructure health and performance using custom dashboards and real-time metrics
- Collect, analyze, and alert on logs from applications and cloud services
- Set up APM (Application Performance Monitoring) to trace microservices and detect bottlenecks
- Create custom monitors and alerts using threshold, anomaly, and log-based conditions
- Use Datadog with AWS, Azure, GCP and track cloud resource performance and costs
- Implement container and Kubernetes monitoring with advanced tagging and auto-discovery
- Automate Datadog tasks using APIs, CI/CD tools, and cloud-native integrations
Course syllabus:
Module 1: Introduction to Datadog
-
What is Datadog?
-
Key Features and Architecture
-
Use Cases (Monitoring, APM, Security, Logs, RUM, CI/CD)
-
SaaS-based Model & Supported Integrations
-
Datadog vs Prometheus, Splunk, New Relic
Module 2: Getting Started
-
Creating a Datadog Account
-
User Interface Overview
-
Setting Up the Datadog Agent (Linux, Windows, Mac)
-
Understanding Agent Configuration Files
-
Agent Status & Validation
Module 3: Infrastructure Monitoring
-
Monitoring Hosts and Services
-
Metrics Collection and Visualization
-
Tags and Metadata
-
Host Maps and Infrastructure List
-
Monitoring CPU, Memory, Disk, Network
-
Using Auto Discovery for Services
Module 4: Dashboards & Visualization
-
Creating Timeboards and Screenboards
-
Dashboard Widgets (Graphs, Queries, Maps)
-
Real-Time Dashboards
-
Using Templates and Variables
-
Sharing and Permissions
Module 5: Monitors & Alerting
-
Creating Metric Monitors
-
Threshold-based Alerts
-
Anomaly Detection
-
Composite Monitors
-
Log & Trace Monitors
-
Alert Routing: Email, Slack, PagerDuty, Opsgenie
-
Scheduled Downtime Management
Module 6: Application Performance Monitoring (APM)
-
Introduction to Tracing
-
Instrumenting Applications (Python, Java, Node.js, Go, etc.)
-
Trace Collection & Sampling
-
Service Maps & Dependencies
-
Request/Latency Analysis
-
Error Tracking
-
Custom Instrumentation with Datadog SDKs
Module 7: Log Management
-
Enabling Log Collection
-
Log Forwarding & Parsing
-
Creating Log Pipelines
-
Enrichment with Tags & Attributes
-
Log Explorer and Filters
-
Archive, Retain, and Rehydrate Logs
-
Log-based Alerting
Module 8: Synthetic Monitoring
-
Synthetic Tests Overview
-
Uptime Tests (Ping, HTTP, DNS)
-
Browser Tests (Transaction Monitoring)
-
Setting Up Global Locations
-
SLA Tracking & Alerting
Module 9: Real User Monitoring (RUM)
-
RUM Basics & Setup
-
Frontend Performance Metrics
-
Page Load Time Analysis
-
Session Replay
-
JS Error Tracking
-
Filtering by Users, Browsers, Regions
Module 10: Container & Kubernetes Monitoring
-
Docker Monitoring
-
Kubernetes Integration (via Helm, DaemonSet)
-
Pod, Node, Namespace Level Monitoring
-
Cluster Maps & Workload Metrics
-
Using Datadog Operator
-
Monitoring Autoscaling & Failures
Module 11: Cloud Integrations
-
AWS Integration (CloudWatch, EC2, Lambda, RDS, etc.)
-
Azure Integration (VMs, App Services, SQL, etc.)
-
GCP Integration (GKE, GCE, Cloud Functions)
-
Cost and Billing Monitoring
-
Setting Up API and IAM Roles
-
CloudTrail and Config for Security
Module 12: Security Monitoring (SIEM)
-
Security Signals and Rules
-
Threat Detection & Triage
-
Cloud Configuration Monitoring
-
Sensitive Data Detection
-
Mapping to MITRE ATT&CK Framework
-
Integration with SIEM tools
Module 13: CI/CD Monitoring
-
Integrating Jenkins, GitHub Actions, GitLab
-
Monitoring Build Pipelines
-
Deployment Tracking
-
Quality Gates & Metrics
-
Monitoring Release Health
Module 14: Custom Metrics & APIs
-
Sending Custom Metrics with DogStatsD
-
Using REST APIs for Automation
-
Tags and Metric Naming Best Practices
-
Building Reusable Scripts for Automation
-
Exporting Dashboards via API
Module 15: User Management & Access Control
-
Creating Teams and Roles
-
RBAC (Role-Based Access Control)
-
API Keys and Application Keys
-
Audit Logs
-
SAML/SSO Integration (Okta, Azure AD)
Module 16: Pricing, Billing & Optimization
-
Understanding Datadog Pricing Model
-
Monitoring Usage by Product
-
Managing Retention Policies
-
Cost Optimization Tips
-
Budget Alerts & Quotas
Capstone Projects (Hands-on)
-
🔧 Full Stack Monitoring Project
-
Monitor a sample web app (frontend, backend, DB)
-
Set up APM, Logs, Dashboards, Alerts
-
-
📊 Kubernetes Observability Project
-
Deploy Datadog on EKS or Minikube
-
Collect metrics, logs, traces, and monitor clusters
-
-
🔐 Security & Compliance Project
-
Enable cloud security posture
-
Create alerts for misconfigurations & threats
-
Tools Used
-
Datadog Web UI
-
Datadog Agent
-
Datadog CLI
-
APIs & SDKs
-
Docker & Kubernetes
-
CI Tools (Jenkins/GitHub)
-
AWS/Azure/GCP Cloud Accounts
How can I enroll for this course?
OR
For any other details, Call me or Whatsapp me on +91-9133190573
Live Sessions Price:
For LIVE sessions – the offer price after discount is 200 USD 159 120 USD Or USD13000 INR 9900 INR 9000 Rupees.
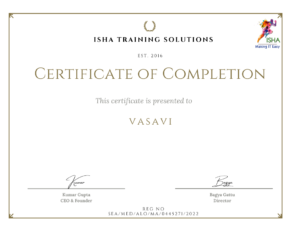
Sample Course Completion Certificate:
Your course completion certificate looks like this……
Reviews:


Course Features
- Lectures 5
- Quiz 0
- Duration 30 hours
- Skill level All levels
- Language English
- Students 0
- Assessments Yes
Curriculum
- 5 Sections
- 5 Lessons
- 30 Hours
- Module 1: Introduction to Datadog1
- Module 2: Getting Started1
- Module 3: Infrastructure Monitoring1
- Module 4: Dashboards & Visualization1
- Module 5: Monitors & Alerting1


