
Back

Performance Engineering Mastery Program – Live Training Demo

Performance Engineering Mastery Program – Live Training (JMeter, LoadRunner, JVM Tuning, Dynatrace, AppDynamics, Oracle AWR, Prometheus, Grafana, Kubernetes, AWS, Jenkins CI/CD) Master the art of Performance Engineering with our comprehensive Performance Engineering Mastery Program. This hands-on training is designed to …

This event has expired

Event Information

  • Price Rs.9,900.00 per participant
  • Location online
  • Start Time 9:00 pm July 1, 2026
  • Finish Time 10:00 pm July 1, 2026
  • Capacity Limited to 100 people

Performance Engineering Mastery Program – Live Training

(JMeter, LoadRunner, JVM Tuning, Dynatrace, AppDynamics, Oracle AWR, Prometheus, Grafana, Kubernetes, AWS, Jenkins CI/CD)

Master the art of Performance Engineering with our comprehensive Performance Engineering Mastery Program. This hands-on training is designed to help professionals build, test, monitor, diagnose, and optimize high-performing enterprise applications across modern cloud-native environments. Go beyond traditional load testing and gain expertise in full-stack performance engineering, observability, cloud performance optimization, root cause analysis, and AI-driven monitoring to ensure scalability, reliability, and exceptional user experiences.

Gain practical experience with industry-leading tools and technologies, including JMeter, LoadRunner, JVM Tuning, Dynatrace, AppDynamics, Oracle AWR, Prometheus, Grafana, Kubernetes, AWS, and Jenkins CI/CD. Learn how to design realistic workloads, execute load, stress, spike, endurance, and capacity tests, analyze application behavior under load, identify bottlenecks across application, infrastructure, database, and network layers, and implement effective optimization strategies using observability data.

Through real-world projects and enterprise use cases, you’ll master Application Performance Monitoring (APM), distributed tracing, metrics, logs, dashboards, cloud monitoring, Kubernetes observability, and AI-powered root cause analysis. Whether you are a Performance Test Engineer, QA Engineer, SDET, DevOps Engineer, Site Reliability Engineer (SRE), Cloud Engineer, Developer, or Solution Architect, this program equips you with the skills to build scalable systems, integrate performance testing into CI/CD pipelines, reduce Mean Time to Resolution (MTTR), and deliver reliable, high-performing digital experiences.

About the Instructor:

Visvashwarr

Visvashwarr is a seasoned Performance Engineering professional with over 11 years of hands-on experience across diverse enterprise domains — including Enterprise SIEM products, Web-based Applications, Web Services (SOAP & REST), Messaging Queue (MQ), ETL Batch Jobs, and Oracle Applications (RMS, RPM, ADF).

Deep expertise in identifying production bottlenecks: Java JVM high Heap usage, Memory Leaks, GC Overhead, Thread Locks, Multithreading issues, UI Page Slowness, Transaction Response Time Degradation, Load Balancing failures, and High Availability testing. Proficient in analysing JVM Heap Dumps, Thread Dumps, and GC logs using Jconsole, JVisualVM, and Yourkit.

Extensive scripting experience with LoadRunner (HTTP/HTML, Web Service, JAVA-Vuser, AJAX Truclient, RDP protocols), JMeter, and ALM Performance Center. Hands-on with Dynatrace and AppDynamics for enterprise APM. Cloud and DevOps experience spans AWS EC2, Oracle Cloud, Kubernetes, Docker, Jenkins CI/CD, and Shell scripting. Python automation: AWR scrubbing, Kibana report generation, and performance enhancements.

Live Sessions  Price:
For LIVE sessions – Offer price after discount is 300 USD 259 USD 119 USD Or 13000 INR 12900 INR 9900 Rupees

Enroll For Free Demo

OR

WhatsApp


Free Demo Session:

Indian Timings:  1st July @ 9 PM – 10 PM (IST)/

U.S Timings:  1st July @ 11:30 AM – 12:30 PM (EST)/ 

U.K Timings:  1st July @ 4:30 PM – 5:30 PM (BST)


Class Schedule:

For Participants in India: Monday to Friday @ 9 PM – 10 PM (IST)

For Participants in the US: Monday to Friday @ 11:30 AM – 12:30 PM (EST)

For Participants in the UK: Monday to Friday @ 4:30 PM – 5:30 PM (BST)


What Students Say about Visvashwarr:

👨 Karthik Rajan : The JVM tuning and heap dump analysis sessions were eye-opening. Visvashwarr explains complex production bottlenecks with real enterprise examples — I’ve never seen this level of depth in any online course.

👩 Priya Venkatesh : From NFR gathering to AWR reports — everything covered live with actual tools. The Jenkins CI/CD integration session was exactly what my team needed. Practical, no fluff, all production-grade skills.

👨 Mohammed Irfan : The Dynatrace and AppDynamics hands-on was incredible. 11+ years of experience really shows — every session has real war stories from production and actionable techniques you can use the next day.

👩 Sneha Kulkarni : The cloud and Kubernetes sessions were excellent. Learning to validate HPA and auto-scaling under load is a skill most performance testers simply don’t have. This course gave me a real competitive edge.


Salient Features:

  • 25 Hours of Live Training along with recorded videos
  • 1 Year Access to Videos
  • Course Completion Certificate

Who can enroll in this course?

  • Performance testers aiming for senior Performance Engineer roles
  • QA engineers and SDETs looking to specialize in performance engineering
  • Automation testers expanding into load testing and observability
  • Software engineers seeking expertise in application performance optimization
  • DevOps engineers and SREs responsible for reliability and scalability
  • Cloud and platform engineers working with AWS, Kubernetes, and microservices
  • Application and production support engineers handling performance incidents
  • Monitoring and observability engineers using Dynatrace, AppDynamics, Prometheus, or Grafana

What will I learn by the end of this course?

  • Design and execute end-to-end performance testing strategies using JMeter and LoadRunner for web, API, microservices, and cloud applications.
  • Monitor and troubleshoot production bottlenecks using Dynatrace, AppDynamics, Prometheus, Grafana, and AI-assisted root cause analysis.
  • Analyse JVM memory leaks, GC issues, thread contention, heap dumps, thread dumps, and Oracle AWR reports to optimise application performance.
  • Implement performance engineering practices for AWS, Kubernetes, microservices, and integrate automated performance gates into Jenkins CI/CD pipelines.
  • Gain hands-on experience through real-world case studies and capstone projects to confidently pursue Performance Engineer, SRE, and Performance Architect roles.

Course Syllabus:

MODULE 1: Performance Engineering Foundations, Strategy & Test Planning

Build a strong foundation in Performance Engineering concepts and learn how to define performance goals, create test strategies, and plan successful testing engagements. By the end of this module, you will be able to translate business requirements into measurable performance objectives and prepare for real-world performance testing projects.

  • Understanding Performance Engineering fundamentals — performance mindset, testing types, and Shift-Left strategy
  • Defining Non-Functional Requirements (NFRs) and converting business expectations into measurable SLAs and KPIs
  • Creating performance test strategies, workload models, and success criteria for different applications
  • Planning test environments, infrastructure readiness, and realistic test data for effective execution

MODULE 2: Performance Testing Tools — JMeter, LoadRunner & HAR Analysis

Gain hands-on experience with industry-leading performance testing tools and learn how to analyze application behavior across multiple system layers. By the end of this module, you will be able to create load tests, analyze HAR files, and troubleshoot performance bottlenecks effectively.

  • Recording and executing your first load test using JMeter, along with an introduction to LoadRunner architecture — VuGen, Controller, and Analysis
  • Understanding performance testing protocols including HTTP, SOAP, REST, AJAX, and RDP
  • Capturing and analyzing HAR files using Chrome DevTools to identify client-side performance issues and hidden bottlenecks
  • Building a Performance Layers Map covering Browser, Network, Application, JVM, Database, and Cloud, while using Linux monitoring tools such as Nmon, sar, iostat, htop, and top for diagnostics

MODULE 3: Monitoring & Observability

Learn how to monitor applications in real time and build end-to-end observability across metrics, logs, and traces. By the end of this module, you will be able to create dashboards, analyze logs, configure alerts, and identify performance bottlenecks using modern observability tools.

  • Setting up Prometheus and exporters, writing PromQL queries, and configuring alert rules for key performance metrics
  • Building real-time Grafana dashboards to visualize KPIs such as CPU, memory, P95 response time, throughput, and error rates with NFR thresholds
  • Analyzing application logs using Kibana and the ELK stack, performing log correlation, and identifying hidden issues during load tests
  • Gaining hands-on experience with Dynatrace and AppDynamics for automatic instrumentation, service flow mapping, and AI-driven root cause analysis

MODULE 4: JVM Internals & Performance Tuning

Develop a deep understanding of JVM internals and learn how to diagnose and resolve Java application performance issues. By the end of this module, you will be able to analyze memory behavior, troubleshoot thread issues, and optimize JVM performance for production workloads.

  • Understanding JVM architecture, memory models, heap structure, garbage collection algorithms, and GC log analysis for identifying memory leaks and GC overhead issues
  • Analyzing heap dumps and thread dumps using JVisualVM and YourKit to identify deadlocks, thread contention, and multithreading bottlenecks
  • Configuring JVM tuning parameters, implementing effective heap sizing strategies, and optimizing garbage collection performance
  • Troubleshooting real-world performance issues including UI slowness, transaction response time degradation, load balancing challenges, and high availability considerations

MODULE 5: Database Performance & Optimization

Learn how to identify, analyze, and resolve database performance bottlenecks across traditional and microservices-based architectures. By the end of this module, you will be able to interpret database reports, optimize SQL queries, and improve overall application performance.

  • Analyzing Oracle AWR reports, identifying top wait events, assessing database parameters, and automating AWR report analysis using Python
  • Optimizing SQL queries through execution plan analysis, indexing strategies, and workload-based database tuning techniques
  • Improving ETL batch job performance and understanding database resource utilization under high-load scenarios
  • Managing database performance in microservices architectures, including connection pooling, distributed transactions, caching strategies, and service-to-database interactions

MODULE 6: Cloud, Kubernetes & Microservices Performance

Learn how to engineer and validate application performance in modern cloud-native environments. By the end of this module, you will be able to test distributed systems, optimize containerized workloads, and troubleshoot performance issues across microservices architectures.

  • Performing cloud performance testing on AWS EC2 and Oracle Cloud, including distributed load generation, auto-scaling validation, and cost versus performance analysis
  • Designing Kubernetes performance strategies, testing Horizontal Pod Autoscaler (HPA) behavior, and optimizing Docker container performance using shell automation scripts
  • Conducting SOAP and REST API performance testing while understanding performance considerations for SIEM applications
  • Implementing distributed tracing techniques to analyze end-to-end transaction flows and identify bottlenecks across microservices environments

MODULE 7: AI, Root Cause Analysis & Performance Reporting

Learn how to leverage AI for proactive performance management and master structured root cause analysis techniques. By the end of this module, you will be able to identify anomalies, isolate bottlenecks, and communicate performance insights effectively to technical and business stakeholders.

  • Applying AI and machine learning techniques for anomaly detection, predictive analysis, and automated root cause identification within performance workflows
  • Using structured root cause analysis methodologies to isolate bottlenecks, investigate performance defects, and conduct evidence-based troubleshooting
  • Building a systematic approach to performance engineering using proven investigation frameworks and AI-assisted diagnostics
  • Creating executive-ready performance reports, visualizing test results for non-technical audiences, and delivering actionable benchmarking recommendations and test deliverables

MODULE 8: Real-World Project Execution & Career Growth

Apply everything you have learned by executing a complete end-to-end performance engineering project and prepare for a successful career in the industry. By the end of this module, you will be able to plan, execute, analyze, and present performance testing outcomes with confidence.

  • Executing a real-world performance engineering project from planning and scripting to test data preparation, load execution, and live monitoring
  • Analyzing test results, performing root cause analysis, and delivering performance tuning recommendations based on collected evidence
  • Creating comprehensive performance reports and presenting findings effectively to technical teams and business stakeholders
  • Preparing for performance engineering careers with interview guidance, resume and LinkedIn optimization, salary insights, and personalized career roadmaps


How can I enroll for this course?

Enroll For Free Demo

OR

For any other details, Call me or Whatsapp me on +91-9133190573


Live Sessions Price:

For LIVE sessions – Offer price after discount is 300 USD 259 USD 119 USD Or 13000 INR 12900 INR 9900 Rupees


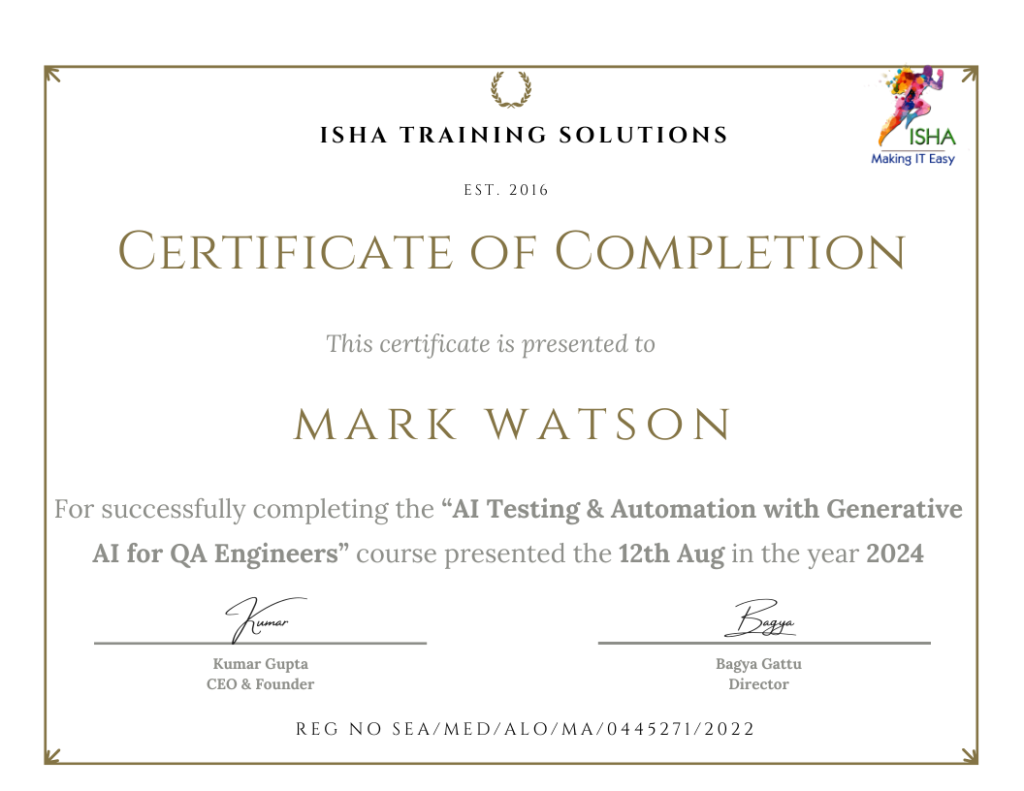
Sample Course Completion Certificate:

Your course completion certificate looks like this….
 

Important Note:

To maintain the quality of our training and ensure a smooth learning experience for all participants, we do not allow batch repetition or switching between courses.

To reiterate, moving from one course to another or shifting from one trainer to another (even if it is the same course) is not possible. Changing batches or trainers in any form is strictly not permitted.

We request all learners to attend the scheduled sessions regularly and make the most of their learning journey. Thank you for your understanding and continued support.


CLICK HERE – ISHA TUITIONS | Grades 1–12 | India • USA • UK • Middle East | CBSE • ICSE • IGCSE • Cambridge • IB • State Boards | CLICK HERE